
Before GitHub issues and pull requests, a lot of QGIS happened on mailing lists. Feature debates, release planning, plugin approvals, “how do I…” questions, and the occasional very long argument about a logo — it’s all there in the public pipermail archives, going back to 2006. But a pipermail archive is a wall of monthly text files. You can read it, but you can’t really see it.
So I built QGIS Lists Explorer: an interactive view of twenty years of the QGIS mailing lists.
I presented it at the QGIS Contributor Meeting 2026 in Laax, Switzerland — a fitting audience, since many of the people in the room are also the people in the charts.
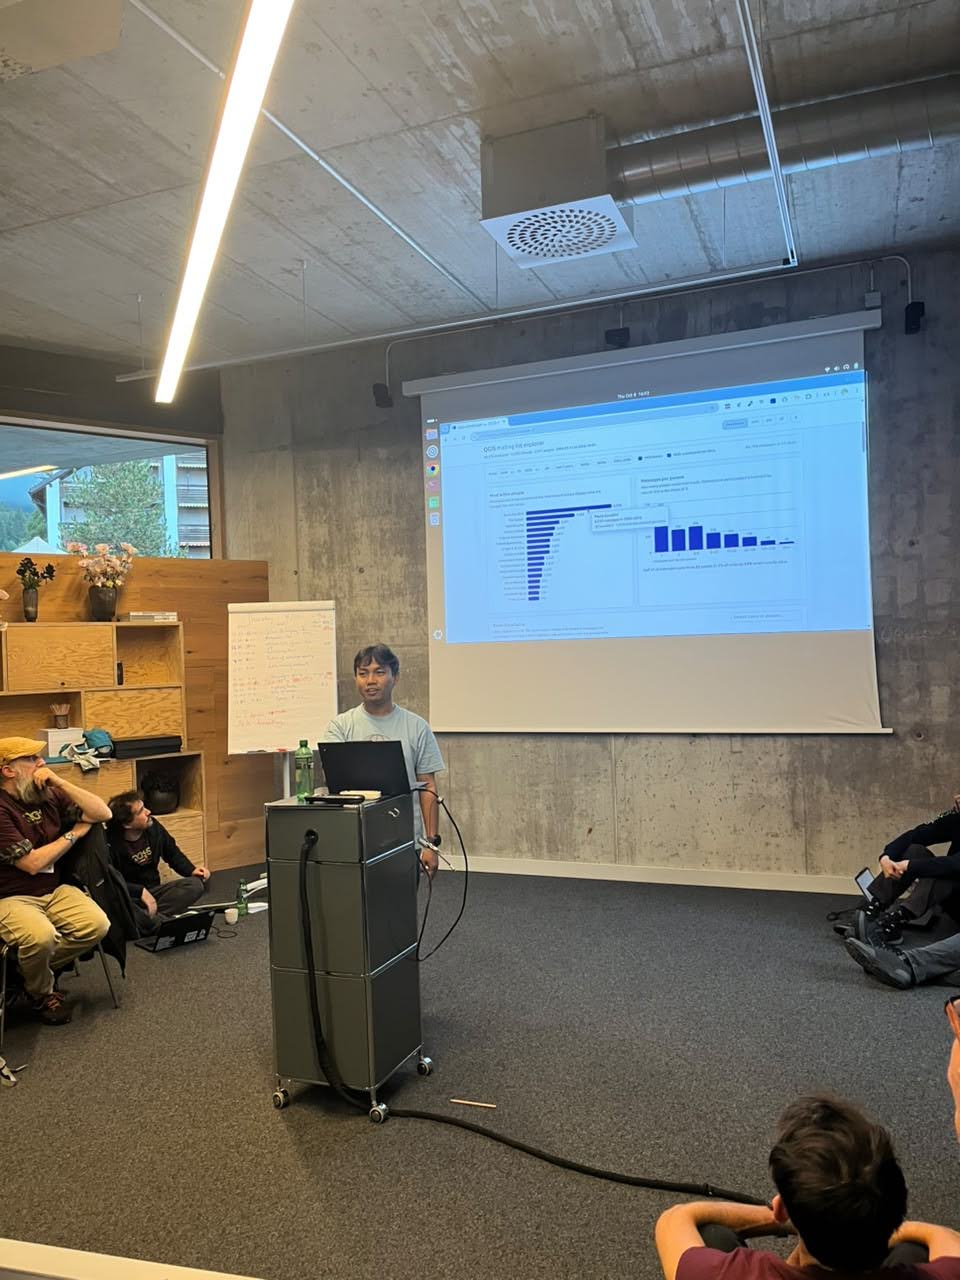 Presenting QGIS Lists Explorer at the QGIS Contributor Meeting 2026 in Laax
What’s in it
It covers three lists — qgis-developer, qgis-user, and qgis-psc (the Project Steering Committee) — plus an all view that merges them. A toggle in the header switches between them.
| qgis-developer | qgis-user | qgis-psc | all | |
|---|---|---|---|---|
| Messages | 68,529 | 56,473 | 10,835 | 135,837 |
| Threads | 16,895 | 16,415 | 1,747 | 33,355 |
| People | 2,044 | 4,873 | 166 | 6,234 |
| Span | 2006–2026 | 2008–2026 | 2008–2026 | 2006–2026 |
The all view is a real merge, not a sum. The three archives are parsed together, so identities and threads are joined across lists: 849 people who write on more than one list become one person, and about 1,700 cross-posted discussions become one thread. The “Logo” debate, for example, is 156 messages across psc and developer — each list alone only shows half of it.
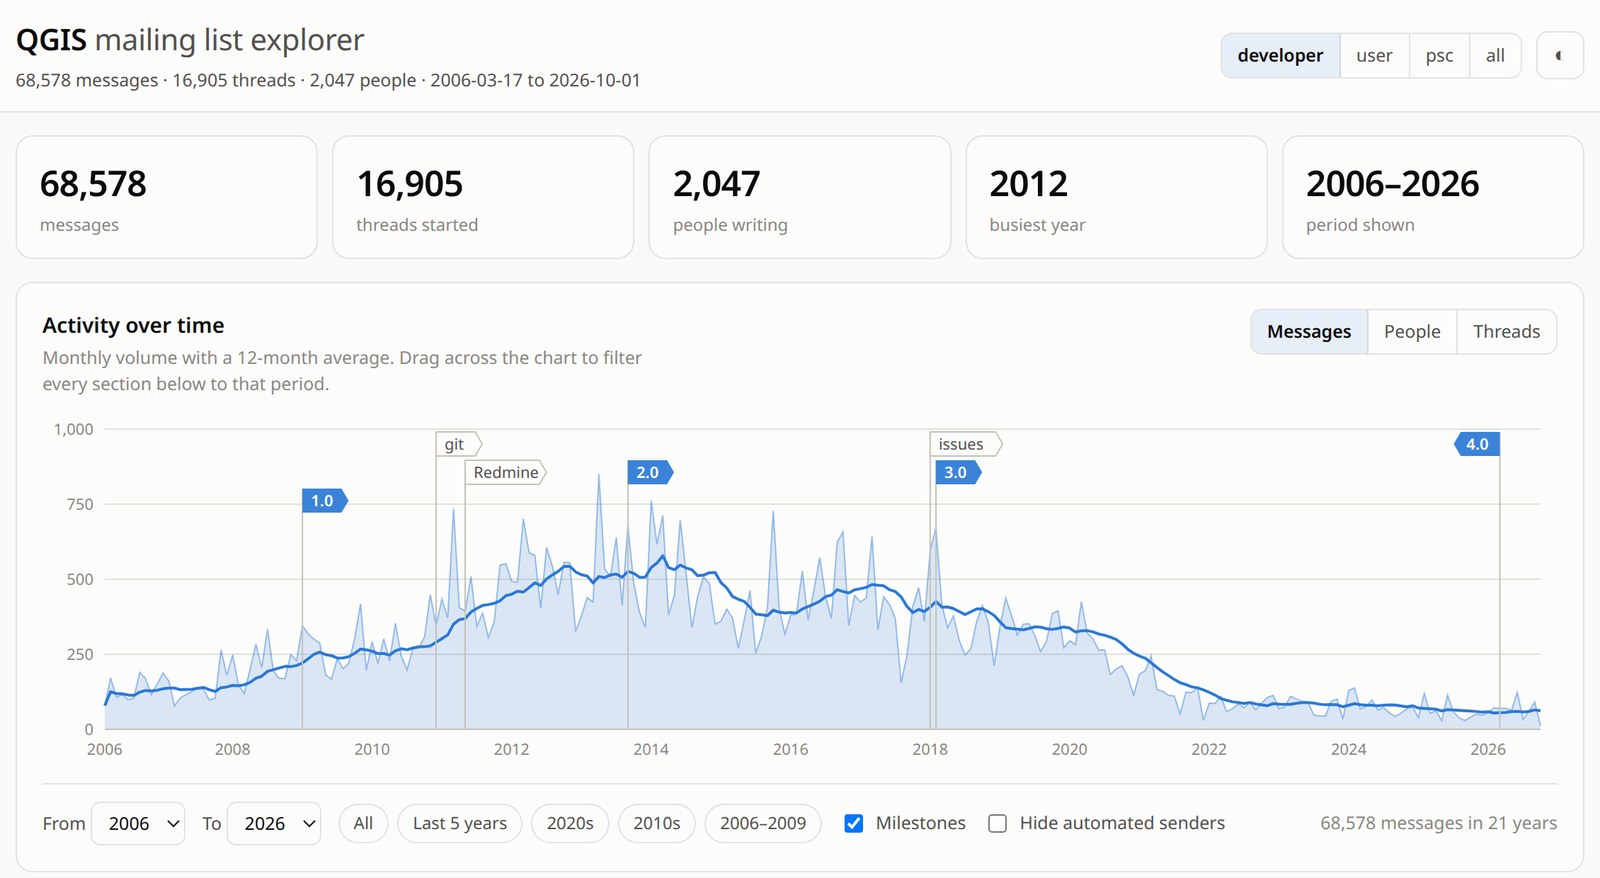 Activity over time on qgis-developer: traffic peaks around 2012–2014 and drops after 2020, when much of the work moved to GitHub
A couple of highlights from the all view, with automated senders hidden:
- Most active people: Paolo Cavallini (9,447 messages), Tim Sutton (5,727), and Andreas Neumann (4,310).
- Most discussed topics: Plugins (2,804 threads), Data & formats (2,577), and Processing & analysis (2,192).
The page answers questions like:
- How has list traffic changed? An activity chart over time, annotated with milestones — releases from 1.0 Kore to 4.0 Norrköping, plus infrastructure moments like the first git workflow thread, the Trac → Redmine migration, and the “last call for switching to GitHub issue tracker”. Drag across it to filter everything else on the page.
- Who writes the most? For any period you pick, with a sortable, searchable contributor table and a per-year sparkline for each person.
- When does the project actually work? A weekday × hour heatmap — the rhythm of a distributed project’s working week.
- How lopsided is participation? The distribution of messages per person.
- Who talks with whom? A co-participation graph: two people are linked when they appear in the same thread. It’s a live force layout — drag nodes to pin them, scroll to zoom.
- What do they talk about? A topic mix per year, and a topic filter on the thread table.
- Which threads drew the most replies, and which never died?
- Is the community renewing itself? Newcomers vs. regulars over the years.
- Where does the mail come from? Share of traffic by sender domain.
There’s also a toggle to hide automated senders. On qgis-developer that removes 3,810 messages and 1,621 threads, most of them plugin-approval notifications — and it moves the charts too, not just the people list.
How it works
A Python script (scripts/parse.py) reads the monthly pipermail mbox archives and writes one aggregated JSON file per list. The page itself is plain static HTML/CSS/JS with hand-rolled SVG charts: no build step, no tracking, no analytics, and no third-party requests at runtime. The only dependency is d3-force (with d3-selection and d3-drag), vendored at 35 KB for the network graph.
Twenty years of email is messy, so most of the work went into parsing. A few things I had to deal with:
- Broken dates. Messages from before February 2008 have a
Date:header clobbered by a list migration, so the mbox envelope line is used when the header disagrees with the archive month. - People change addresses. Several long-time contributors changed employer (and email) over the years. Addresses that share the same full display name are merged into one person, and the table shows
+Nwhen someone’s addresses span more than one domain. - Threading. Threads are rebuilt from
References/In-Reply-To, falling back to normalised subjects within a 90-day window. Empty subjects like “(no subject)” are excluded from that fallback — otherwise they collect unrelated mail into one huge fake thread. - Bots. A sender is flagged as automated by the address they mostly post from, so a human who once forwarded a Dropbox notification is still a human. Every aggregate is built twice, with and without bots.
- Topics without a model. Topics come from a plain keyword taxonomy: an ordered list of regexes matched against thread subjects, first match wins. Cross-cutting rules (platforms, releases, bugs) go last, so “crash on Windows” files as a bug rather than an install question. About 82% of threads match something; the rest are shown as “unclassified” instead of being quietly dropped. The rules are meant to be read and disagreed with.
The data stays fresh on its own: a GitHub Action runs the update script on the 2nd of each month, fetches only the new (unclosed) months, and commits the result. GitHub Pages serves the docs/ folder directly, so a refreshed JSON is all a new deploy needs.
Privacy
The archives are public, but that’s not a reason to make personal data more accessible than the source does. So:
- No email addresses are published — only display names and the domain people write from. Addresses exist only in the local raw mirror and are discarded after the identity merge.
- The page is marked
noindex, just like the OSGeo archive pages, so the tool doesn’t make anyone easier to find by name than the source does. - Anyone who would rather not appear can open an issue and be removed.
Caveats
The counts are “messages that reached the list”, which is not the same thing as contribution. Much of QGIS development moved to GitHub after around 2020, and the traffic curve shows that plainly. Likewise, sender domains tell you where mail comes from, not who funds the work — free mail providers dominate both main lists.
Try it
Have a look at ismailsunni.id/qgis-lists-explorer, find yourself (or your favourite long-running thread), and if you spot something odd — a wrongly merged person, a topic rule that misfiles things — issues and PRs are welcome.